How musl (and a lucky accident) cut my Rust service's memory
 rolandjitsu
I had a Rust service that ate memory for breakfast. The fix that helped the most, I stumbled into completely by accident - and it had nothing to do with the code I’d been sweating over 😅 .
Here’s the whole embarrassing, hopefully useful story.
The setup
The service was a data collector - high-throughput ingest with backpressure, checkpointing, retries, the usual. The design was simple: one thread reads batches of records off a source on a tick, hands them to another thread over a channel, and that thread ships them to a destination.
flowchart LR
    R["Read thread (polls source each tick)"] -->|"batch of records over an mpsc"| W["Write thread (ships data to destination)"]
The batch is a Vec<Data>, and the buffering (and backpressure) all happens in that channel. It pulled records every 50ms or so and kept going until there was nothing left to read - for a big backlog, that could mean chewing through hundreds of millions of records over the better part of a day.
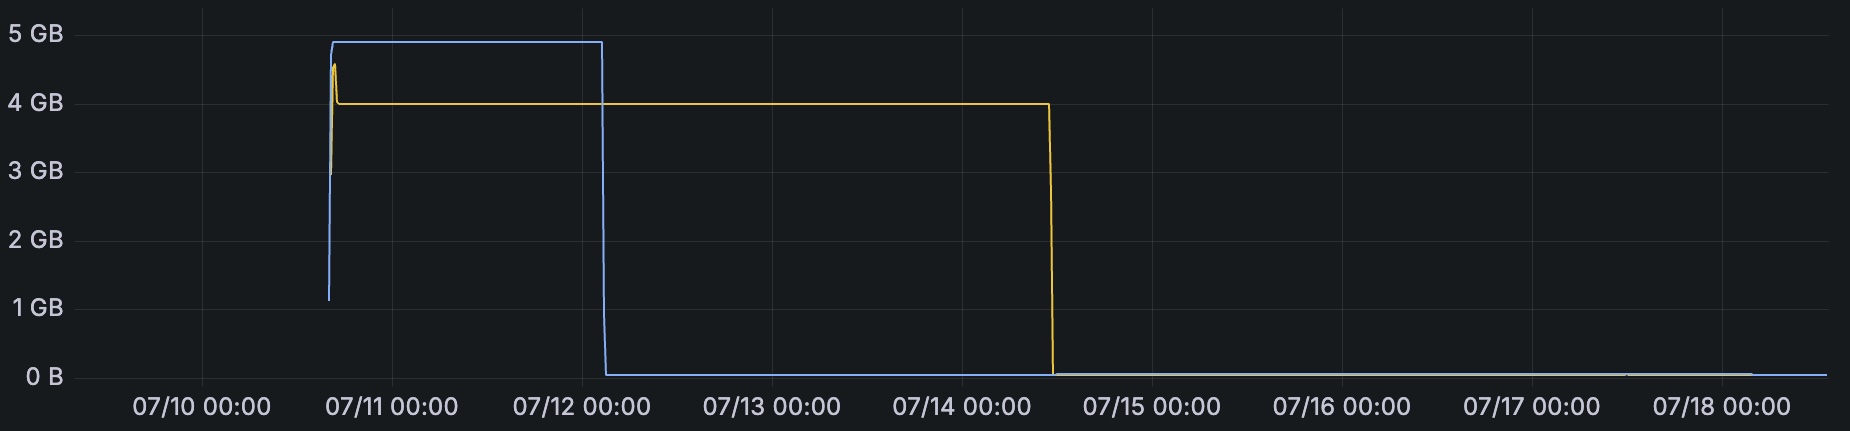
And it was hungry. When things got busy it would climb to around 4.5GB. I wanted it bounded, and much smaller.
Round 1: stop bounding by count, start bounding by bytes
Here’s the trap I’d already walked into. We had a bounded channel - buffered, with a deliberately low limit. Data arrived chunked (batches of ~100 records, with the buffer capped around 32 chunks in flight). On paper that’s a nice, small, bounded queue.
The catch: we were bounding by count. And a single record could easily be ~10MB. So “32 chunks” wasn’t a few megabytes - it could quietly mean hundreds of megabytes sitting in memory. Count-based bounds lie to you the moment item sizes vary.
So I built a byte-aware channel: bound the queue by accumulated bytes, not messages. Two pieces. First, anything flowing through has to estimate its own size:
/// Everything we push through the channel can estimate its own heap size.
trait SizeEstimate {
    fn estimated_size(&self) -> usize;
}
Second, the accounting. Instead of tracking bytes by hand, I leaned on a semaphore as a byte budget: one permit == one byte. To send a value, you acquire as many permits as it has bytes; the permits ride along with the value and are released when the consumer drops it. That release is the backpressure - a big item in flight starves new sends until it’s processed.
use std::sync::Arc;
use tokio::sync::{mpsc, OwnedSemaphorePermit, Semaphore};

/// The value travels with the permits that account for its bytes. When the
/// consumer drops this, the permits return to the semaphore and free up
/// budget for the next send.
struct Metered<T> {
    value: T,
    _bytes: OwnedSemaphorePermit,
}

#[derive(Clone)]
struct ByteSender<T> {
    tx: mpsc::Sender<Metered<T>>,
    budget: Arc<Semaphore>, // total permits == byte budget
}

impl<T: SizeEstimate> ByteSender<T> {
    /// Waits until there's enough byte budget, then sends.
    async fn send(&self, value: T) -> Result<(), mpsc::error::SendError<T>> {
        let bytes = value.estimated_size().max(1) as u32;
        let permit = Arc::clone(&self.budget)
            .acquire_many_owned(bytes)
            .await
            .expect("budget semaphore closed");
        self.tx
            .send(Metered { value, _bytes: permit })
            .await
            .map_err(|e| mpsc::error::SendError(e.0.value))
    }
}
Two things worth calling out:
acquire_manytakes au32, so one-permit-per-byte works up to a ~4GB budget. Past that, count in kilobytes instead.- Mind the oversized item. If a single value is larger than the entire budget, its
acquire_manycan never be satisfied - instant deadlock. Your budget has to exceed your largest possible item (or you special-case the big ones). Given a single record could be ~10MB, this wasn’t hypothetical.
With the pipeline capped by real bytes, memory dropped to ~2.5GB (virtual). Progress! But not the win I wanted.
Round 2: fewer clones, more references
Next I went after the data-parsing path: cut needless clones, pass references, move data through memory instead of copying it. All good hygiene.
It helped… less than I’d hoped. I was starting to run out of obvious ideas.
The accident
Then, while testing, I pushed a manually built binary to a device - and watched memory fall off a cliff. From over 1GB to under 100MB, mid-ingest. And it wasn’t just virtual: resident memory (RSS) also dropped.
wtf. 🤯
My first thought was “did my changes finally kick in?” No - way too big, way too sudden. Confused, I ran ldd on the binary out of pure curiosity:
$ ldd ./my-service
        not a dynamic executable
Nothing linked. It was a static binary - and noticeably smaller on disk. I checked on a different device where the binary was built/shipped via the CI and, sure enough, it was dynamically linked against the system libc and friends.
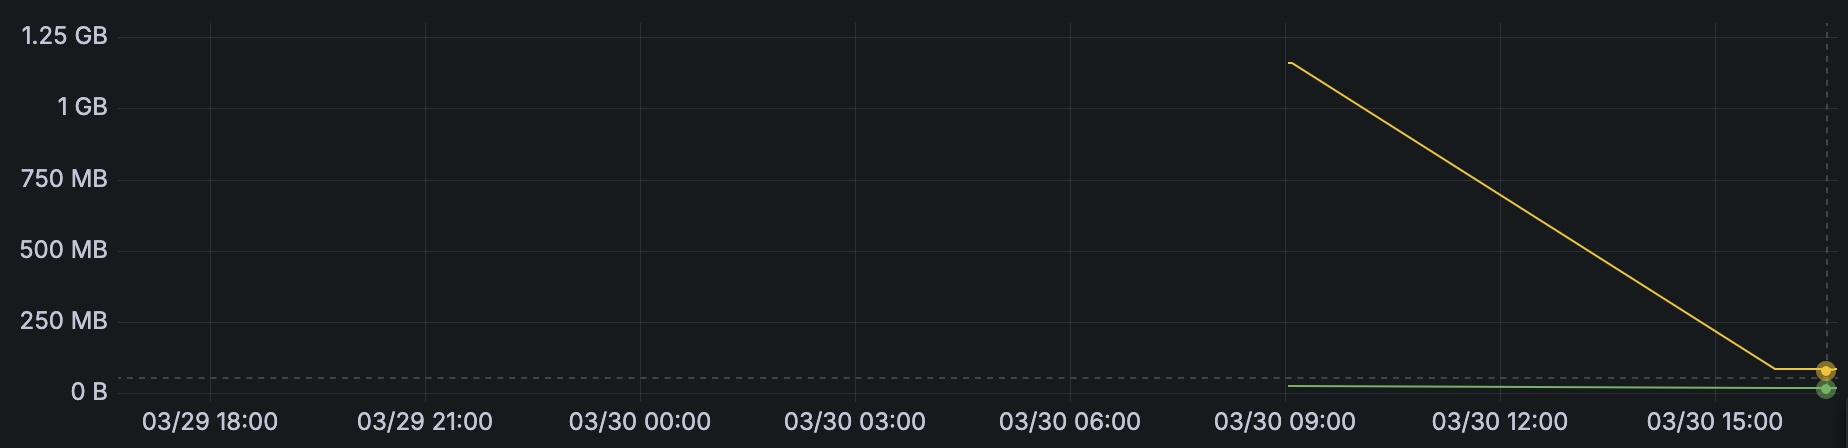
The difference: my manual build produced a statically linked musl binary, while our CI and build tooling link against glibc with shared libraries. Same code, different libc, wildly different memory.
Why it happened
A bit of reading pointed at the culprit: glibc and musl size thread memory very differently. glibc is generous with per-thread arenas and stack reservations; musl is far more frugal.
And I had threads - roughly 16: the async runtime (tokio), an embedded store, and a few others. It turned out a big chunk of what I’d been calling “my memory usage” wasn’t the data pipeline at all. It was threads and libc.
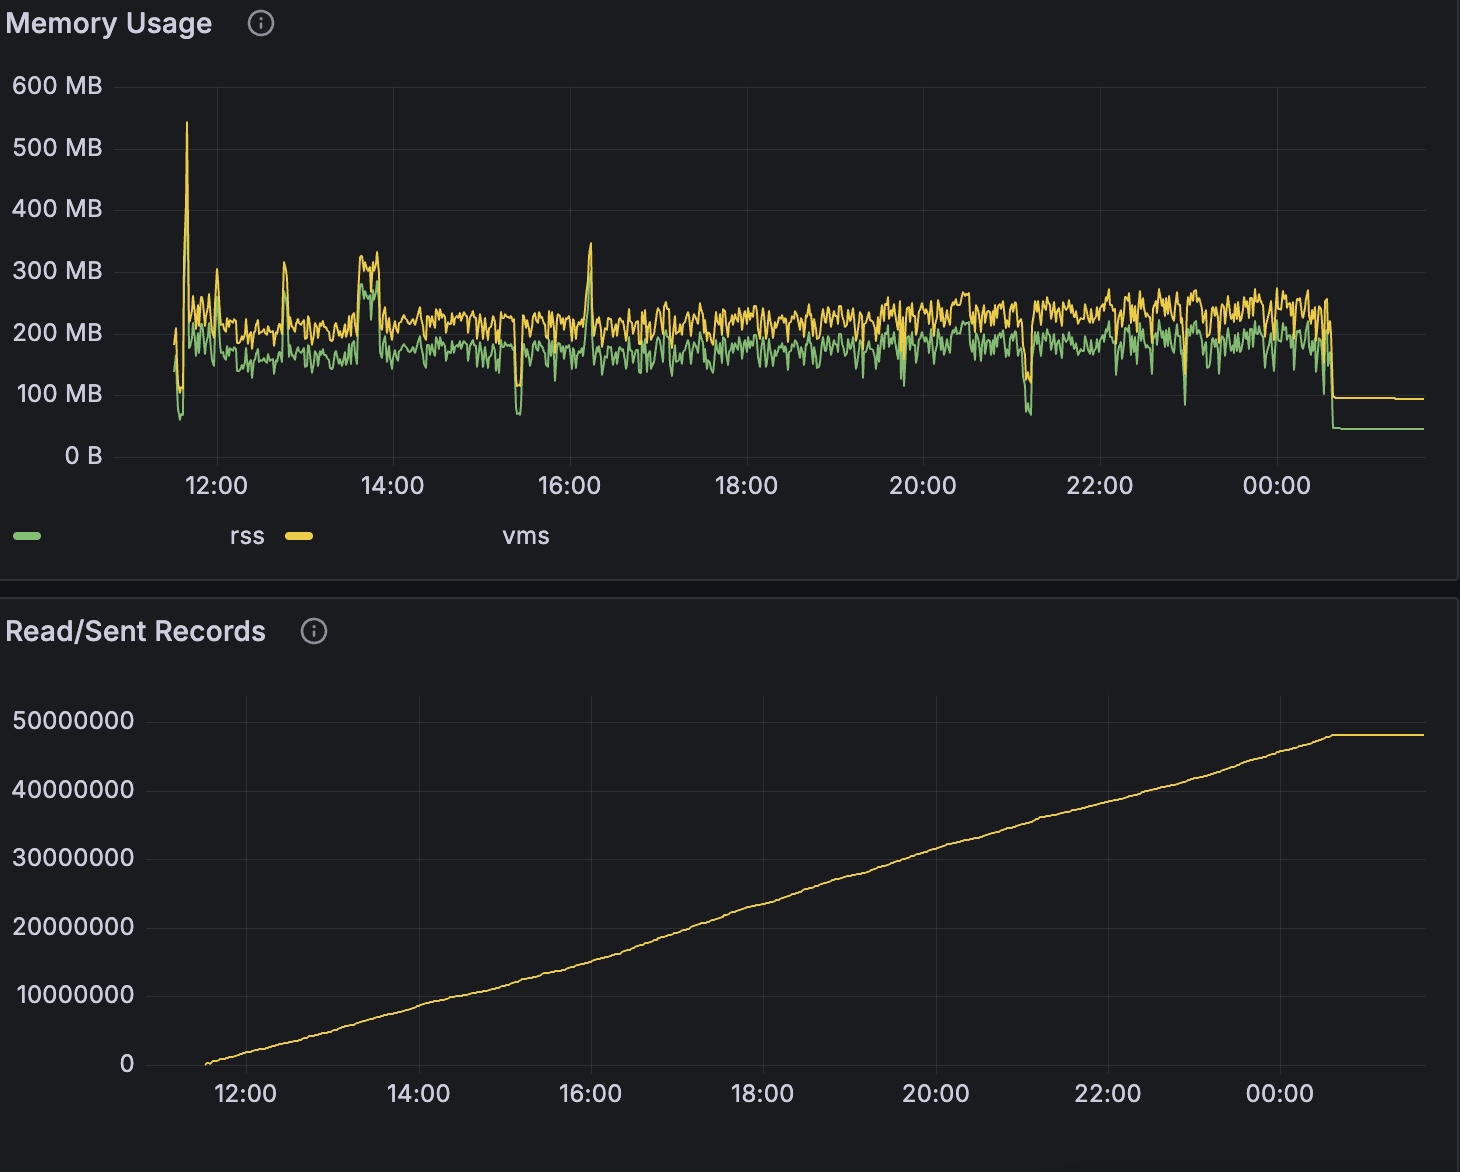
A note on VMS vs. RSS, because it’s easy to overstate this: glibc’s arenas reserve address space it may never fault in, so some of the VMS drop is just accounting. But here RSS dropped too - the shape followed the VMS - so this was a real resident win, not a virtual-memory mirage. With ~16 threads, glibc’s per-thread overhead was costing actual pages, and musl simply doesn’t reserve as much. Measure both numbers so you know which kind of win you’ve got; this one was both.
The other culprit: logging
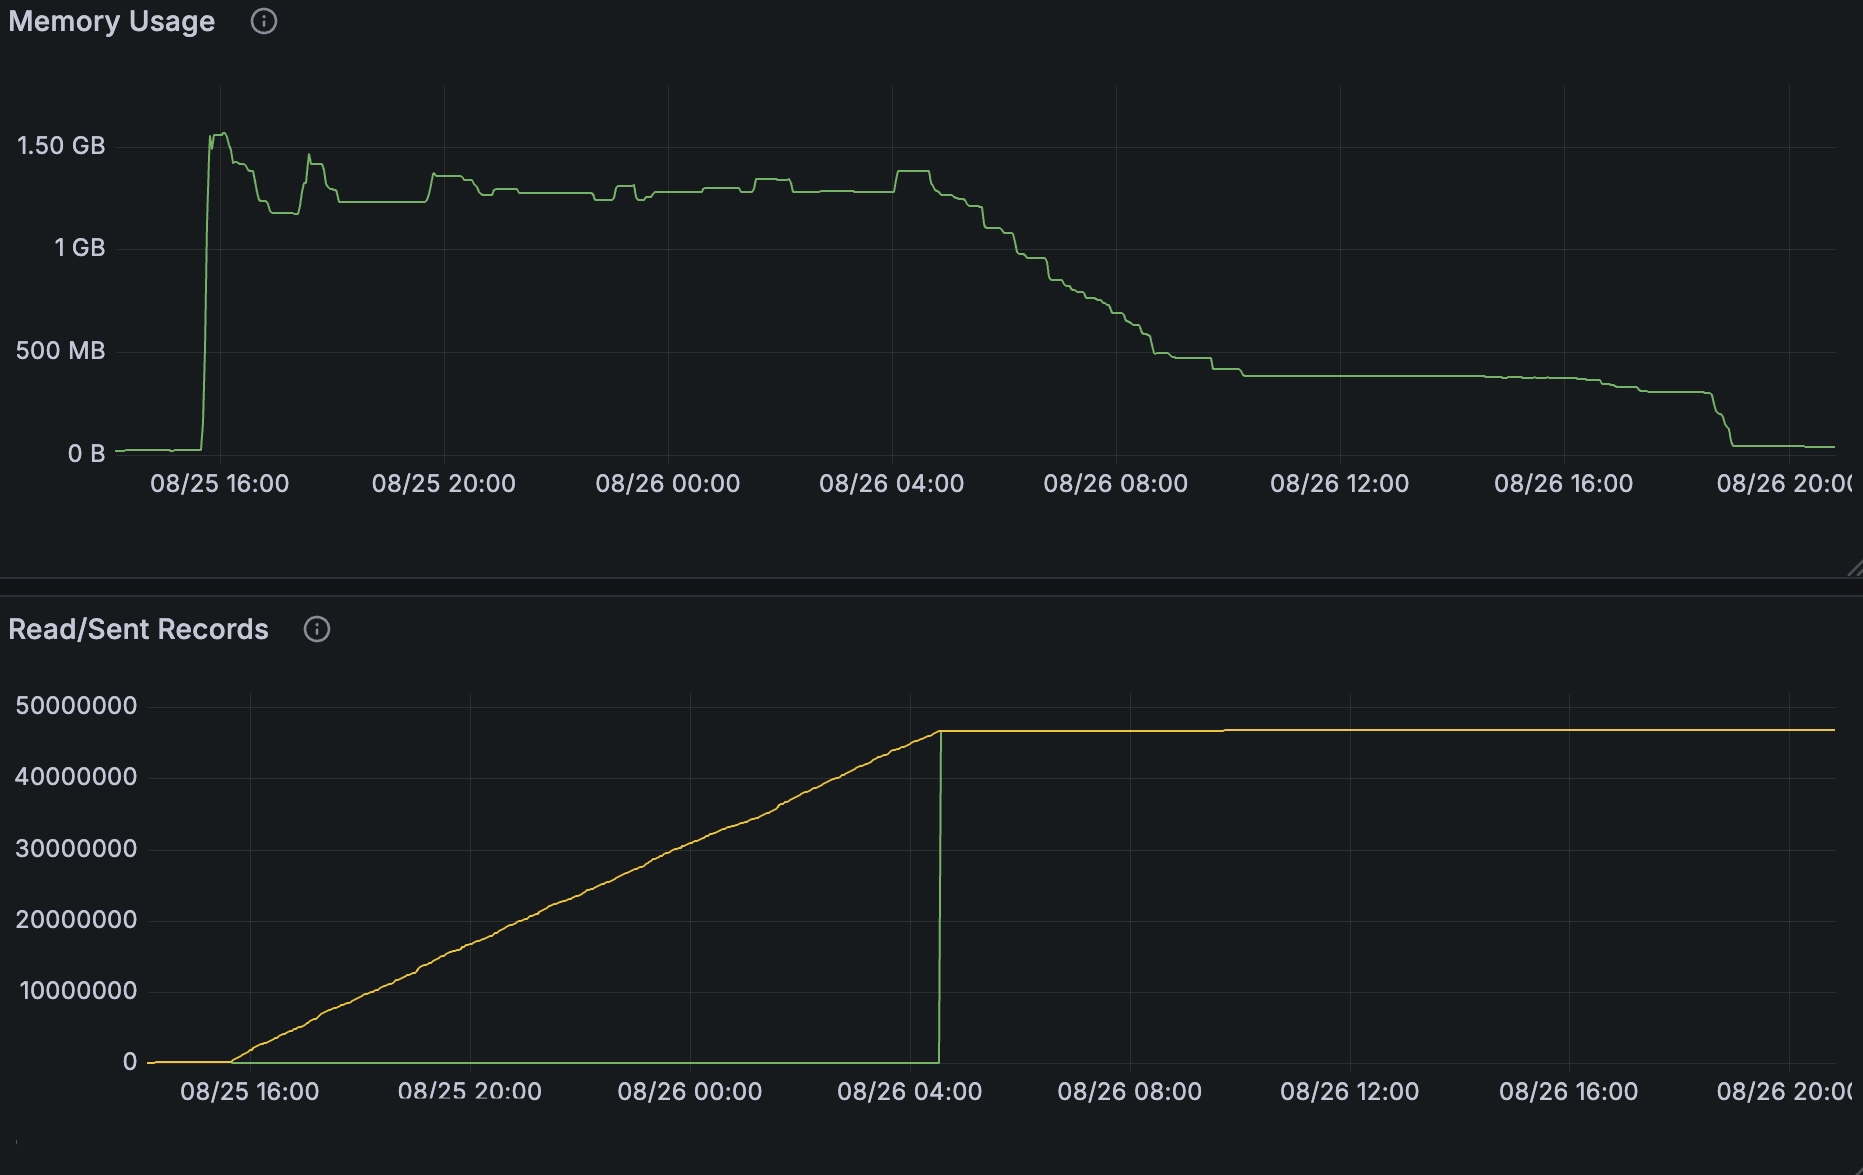
musl wasn’t the whole story. When the service was busy, our tracing setup at trace level was holding on the order of ~1GB on its own. Verbose subscribers aren’t free - under high throughput, all that structured logging adds up fast.
The fix was cheap: make the log level switchable at runtime, and run info in prod - keeping trace a flip away for when you actually need to dig. That alone clawed back most of the difference.
Other approaches I considered
I didn’t land on the byte-aware channel because it was the only option - it’s just the one I could ship without rearchitecting. A few others I considered:
- Count bytes by hand on both ends. Measure before pushing to the channel, stop at the max, and have the consumer ack how many bytes actually made it over the wire so the reader can subtract them - a shared counter between the read and write threads. It works, but it defeats the point: if I’m bolting my own sync on top, why use a channel at all?
- Encode to the wire shape before the channel. Parse and encode into the exact bytes that go over the network before sending, so the size is true rather than estimated. More accurate, but it couples the reader to what the consumer does with the data. (One shape end-to-end would’ve been cleaner, but the source and destination shapes were genuinely different.)
- Ditch the channel entirely and write a custom, byte-aware buffer.
Reworking the architecture wasn’t something I could take on at that point, and there are probably better designs than any of these. But once optimized, what I had worked just fine - and “works fine, shipped” beats “perfect, someday.”
What I took away from it
- Build the same way everywhere. The single most useful fix came from a build path that didn’t match CI. If dev, CI, and prod don’t build identically, you’re setting yourself up for exactly this kind of surprise - a happy one this time, but it could just as easily have gone the other way.
- musl is frugal with thread memory - and hands you a smaller binary as a bonus. If your service is thread-heavy, the libc you link against can matter more than your code.
- Static binaries are great when you want a self-contained artifact with zero OS dependencies - but they can get large if you link in a lot of deps. Tradeoffs, always.
- Verbose logging isn’t free. A
trace-level subscriber under load was worth ~1GB by itself. Make your log level tunable at runtime: crank it when you’re debugging, keep it sane in prod.
The takeaway: I spent days optimizing the thing I assumed was the problem (my pipeline), and the biggest wins came from things I wasn’t even looking at - the toolchain and the logger. Sometimes the fastest way to cut memory isn’t in your code at all.
Update 01.09.2026
I’ve published a variation of the weight-based mpsc channel as a crate: weighted-mpsc. Source available at rolandjitsu/weighted-mpsc.